by Andrew Mosedale, Head of Aerodynamics, ARC
As technology advances, the challenge for many industries is not how to gather enough data, but rather how to manage the exponential wealth of information becoming available. For IndyCar, this means reviewing the telemetry data of hundreds of cars from the past few years of racing and testing. Developing a single car in isolation has been challenging enough, but looking in detail at the effect of traffic, the second-by-second GPS updates as cars jockey for position around each corner, increases the task exponentially and presents a fascinating challenge to keep on track.
While longer-term work is ongoing to upgrade driver-in-loop (DIL) simulators to model the effects of racing scenarios, IndyCar is pressing ahead with updates on a race-by-race basis using track testing, wind tunnel and computational methods (CFD) to improve the close-combat handling performance. In partnership with the Indianapolis-based Auto Research Center LLC (ARC) and High Performance Compute (“HPC”) resource provider R Systems NA, Inc., a program has been set up to investigate the behavior of multiple cars in close proximity through a series of stages that promises to deliver deeper understanding – and a better experience for fans.

One path for development has been to map the impact on performance as a function of position relative to another car. This has helped guide the transition from then individual manufacturer aerokits to the universal aerokit introduced in 2018. Using the extensive computational resources provided by R-Systems, and the expertise of ARC with their software suite ELEMENTS, simulations are being run with cars in a range of statistically-determined positions to create a model with machine learning that can help visualize the task in new ways, such as shown in Figure 1. This ‘drafting aeromap’ has helped identify several key factors affecting performance in the wake of another car. It has long been understood that entering the tow of another vehicle reduces the drag (and downforce) experienced by the following driver, allowing them to close up on the straights so long as they can hang on around the corners. A critical factor in this is the balance of downforce between the front and rear tires. Typically, the front wing sees more disruption than the rear wing, and so disproportionately more front downforce is lost, causing the following car to understeer. But this is complicated by the influence of the floor (underwing). Being so close to the ground, the air is less disturbed so the balance of the components in ground effect is an important consideration in predicting the response when entering the wake of another car.

Figure 1 – Surrogate model of the percentage loss in drag due to following another car, by position
Understanding the effects of this ‘low-energy’ wake flow can help with getting into a position to attempt an overtake, but as the distance between the cars comes down clear zones of influence appear to upset the handling of the car further. As the cars jink from side-to-side, the relative position of the front wing and wheels of the following car to the rear diffuser and wheels of the leading car can cause it to switch from understeer to oversteer in a matter of inches. And even with the simplified front wing and endplate configurations seen last year, there is still a lot of sensitivity and variation across the span of the wing that can lead to some unanticipated consequences.
Improving any one of these flow behaviors is manageable using traditional approaches, but considering the knock-on effect on the handling in another position, not to mention the one-lap speed in free air, means care needs to be taken to improve performance as a whole. To this end, ARC and IndyCar have identified a typical overtaking trajectory using real race data that shows a car passing through all these critical zones and is using this path to evaluate changes to see where the car is weaker or stronger.

Figure 2 – GPS tracking of cars during the 2018 Indy500
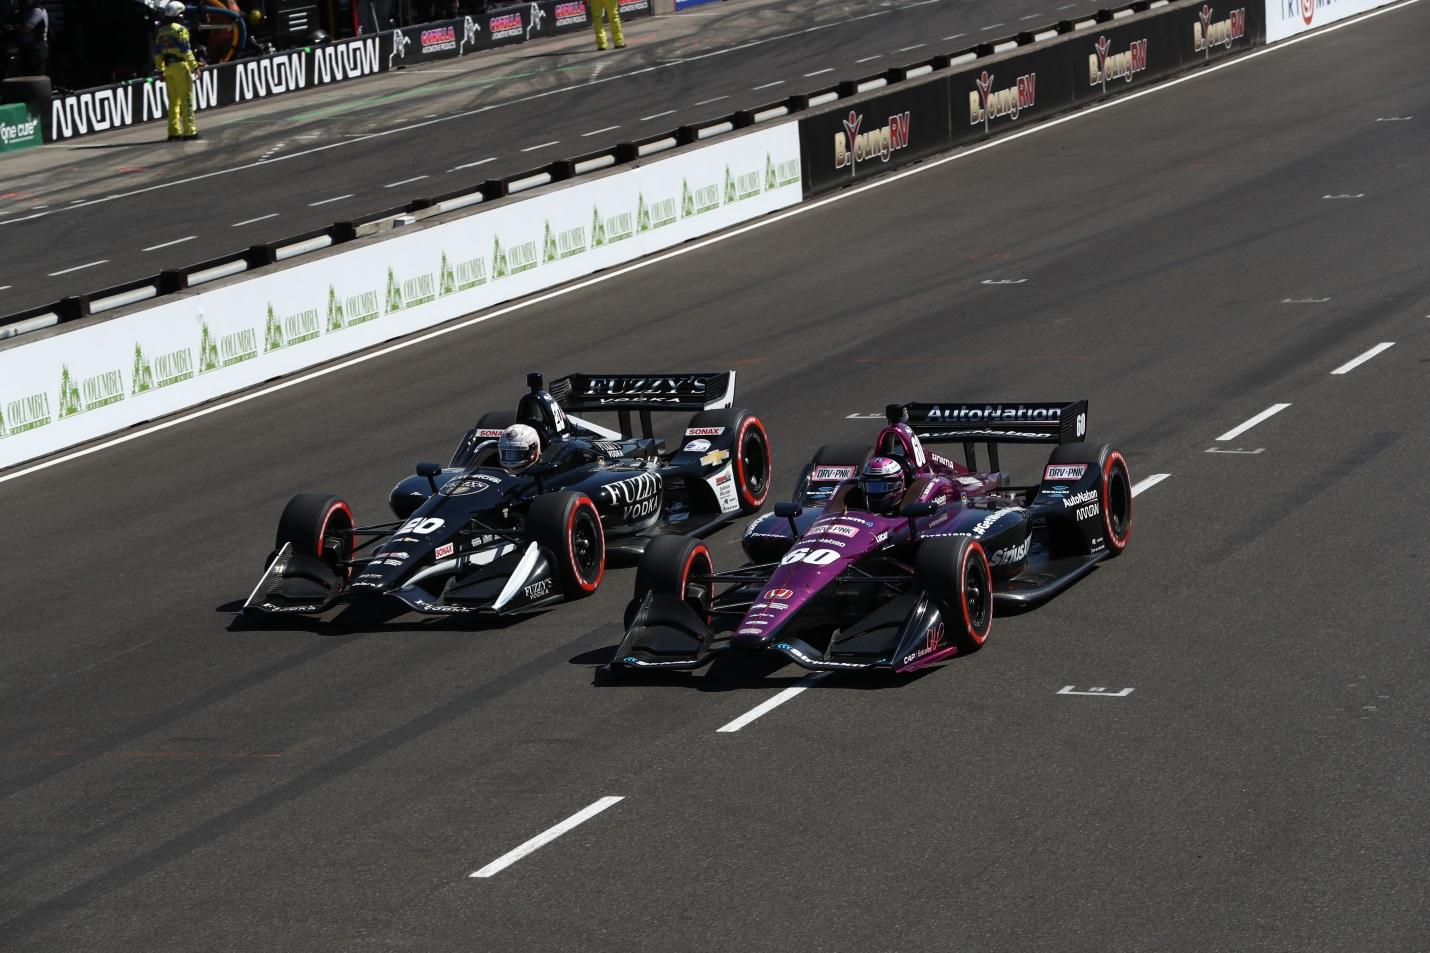
Figure 2 shows the GPS trace of all the cars on the circuit. By combining the on-board data with video footage, several ‘simple’ overtakes were selected to characterize the manoeuvre. The criteria were for the following car to close on the straight without the leading car trying to break the tow, and to the pull out and alongside before the corner. Selecting these criteria reduces the number of variables that need to be accounted for when setting up the analytical models to understand the car performance and effect on any proposed developments to the bodywork. The chosen trajectory, shown in Figure 3, is for an inside pass, although data showed that overtaking in the 2018 Indy500 was evenly split between the inside and outside lines. Based on previous work to understand the effects of the wake on a following car, this trajectory was further broken down into five points, so that CFD could be run for each case with two cars in the respective positions. By comparing the effect on drag, downforce and balance for the following car from the UAK18 bodykit development proposals, as well as referencing the 2017 aerokits, a better picture of the respective strengths and weaknesses of each setup in traffic could be identified – and the detailed flow field available from the CFD provides further aerodynamics understanding to continually improve the ability of the drivers to race.
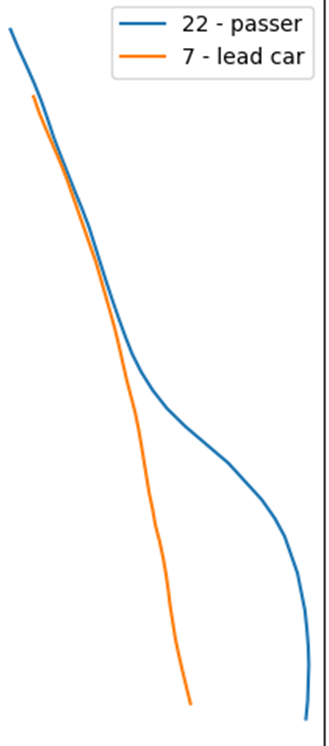
Figure 3 – GPS track of a representative overtaking trajectory
The first critical position for setting up an overtake is also the most familiar. Perhaps one of the fundamental differences between the 2018 Indy500 and previous editions – and one common to all racing – is whether a car gets closer or further away once it is within the turbulent air of another car. This is represented by the 50m following condition in the passing trajectory, a gap of about half a second. The focus on this position is understandable. Improve performance here, and the cars will follow closer and have more opportunities for overtaking. As is often the case, there are several competing elements in play for maximizing performance.

Figure 4 – Turbulent wake 50m downstream of leading car, colored by total pressure
The turbulent wake of the leading car at this distance is shown in Figure 4. As can be seen, the flow unstructured and the mean wake can be considered to be a uniform low energy zone where the following car will experience reduced air velocity. The most obvious consequence of this is a reduction in drag, the key to slipstreaming. Set against this is a reduction in downforce, as reduced air velocities mean all forces are proportionally less. In simple terms, the following car gains on the straights but loses in the corners as it struggles for grip. The effect for a typical UAK18 setup compared to the manufacturer aerokits of the previous year is shown in Figure 5.

Figure 5 – Loss in performance from following 50m behind another car
The results show that the UAK18 experienced a bigger reduction in both drag and downforce than previous years, implying a bigger wake effect. Comparing the wakes from these different vehicles confirms that the wake area from the UAK18 is larger, mostly due to the removal of the rear wheel guards (Figure 6). It punches a bigger hole in the air, so the tow was greater, but still it was difficult for cars to close that gap. The answer is in the downforce, and more specifically how the change in balance affected handling.

Figure 6 – Larger wake in UAK18 (Top) compared to previous models with wheel guards (bottom)
Teams reported, and the simulations confirmed, that the cars were seeing a >1% shift in downforce from front to rear in this position – which was an issue compared to previous years. While we have seen how the design of the rear of the leading car can have a big impact on the size of the wake in general, there is a lot more to examine in the front end of the following car, and again CFD can help where intuition fails. Looking in detail at the velocity distribution of the wake, some general conclusions can be drawn. As expected, the wake effect is strongest in the center. A simple rule of thumb for designing for good traffic performance is to put the large, bluff components that create a lot of drag in this region, and move your downforce generation as far to the sides as possible. Of course, the biggest drag components in open-wheel racing are the wheels themselves which are always going to be exposed. Using front wing endplate design to partially shield the wheels means sacrificing the best location for making downforce. Similarly, the underfloor is a strong downforce-generating component but is not in the best location. However, the lowest parts of the underfloor are close enough to the ground to benefit from higher air velocities than might be expected due to the wake boundary layer (Figure 7). In fact, this higher energy layer of air is crucial to understanding how the different aerokits perform at this following distance. In typical configurations, the wings suffer more than the underfloor in the wake.

Figure 7 – The velocity gradient boundary layer on the ground results in higher velocities for the underfloor than the wing
The main components determining the balance of downforce are the front and rear wings, and the underfloor. Looking at the UAK18 car compared to previous years, one of the objectives was to reduce the complexity of the wings (Figure 8). This resulted in less downforce being generated by the wings, and so more work was being done by the floor. When taking the wake effects into account, this effect is magnified and the floor begins to dominate the overall balance. Although it is tempting to think that a loss in front balance is due to the front wing being more exposed to the wake than the rear wing, calculation of the wing forces show that both wings lose proportionally the same amount of downforce (18%) – the overall ratio of front to rear is unchanged. The rearwards shift in balance was due to the increased prominence of the underfloor which only loses 13% of its downforce. The wings can be considered to be a single system that is biased towards the front, while the floor is biased towards the rear. Since the wake weakens the wings more than the floor, the overall balance of the car shifts rearwards. This presented a particular challenge at last year’s Indy500 as many teams were already at the limit of front wing adjustability and struggled to compensate for this loss in front downforce.
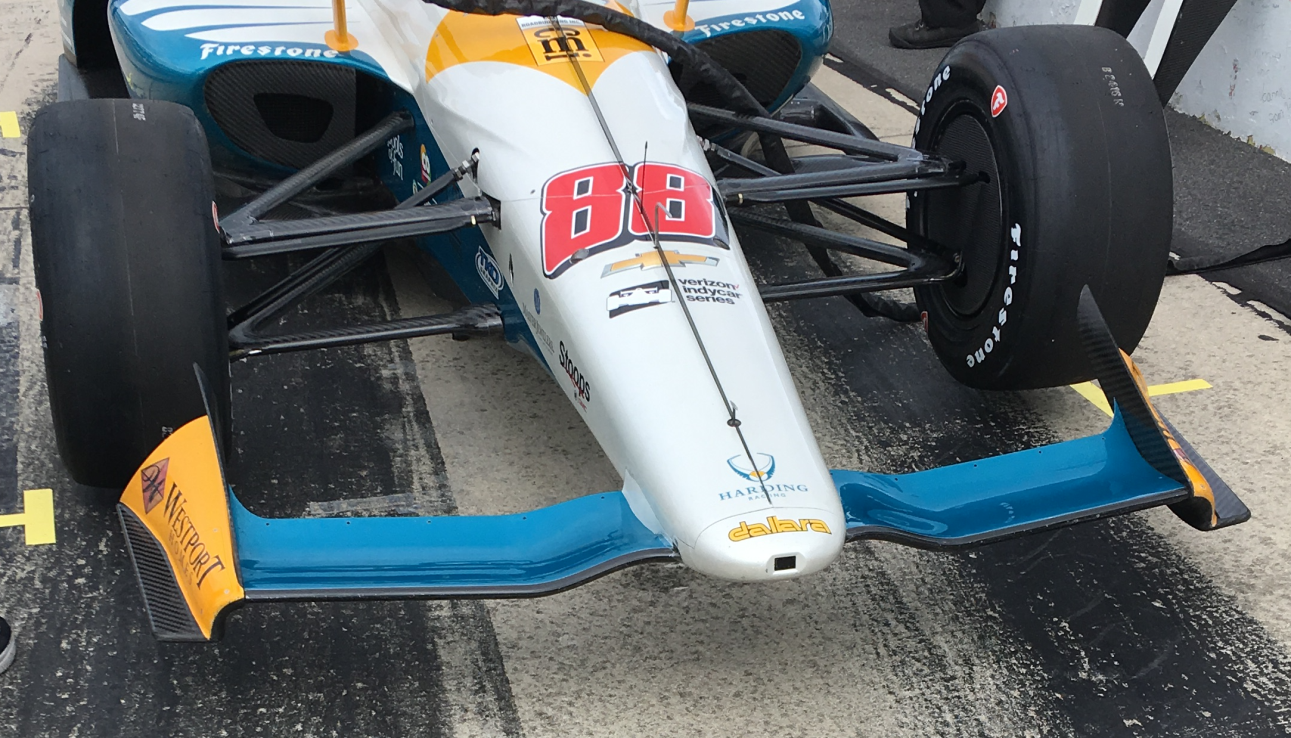
Figure 8 – Reduced complexity of the UAK18 wing. One consequence is that more air reaches the floor
Some of the changes being considered are intended to tackle this very issue. One option being explored is to increase the surface of the floor at the front end to make the underfloor balance neutral. Other possibilities involve changes to the front wing to increase the downforce generated at the outer ends so that the wing suffers less of a wake effect. Caution is required when implementing these changes as they themselves will change the shape of the wake when implemented on the leading car so many iterations are needed to find a solution that actually delivers the targeted improvement. But with a good understanding of what is needed, and with the tools to evaluate the changes in detail, progress is being made.
Of course, allowing the cars to follow closely is only one part of the puzzle. Actually passing another car is a different matter, and it is not uncommon to see cars pulling alongside before having to drop back. Often the cars are alongside in the corner, where handling is even more important to avoid understeering or oversteering right into the other car or off track. Any change to the design to get the cars racing closer together has to also allow them to overtake and to evaluate this, the remaining points of the passing trajectory are also run (Figure 9). Again, the effect on performance of the following car in these positions can be understood through examining both the wake structure from the back of the leading car and the front end design of the chaser.

Figure 9 – Relative performance at different points in the overtake manoeuvre for UAK18
Looking at the wake in figure 10 when the cars are only 5m apart some of the same conclusions can be made as before, but there is much more structure to the flow that creates additional effects. In general, the flow in the center is rising in the upwash of the diffuser, while to each side the air is pulled down as it passes over the rear wheels. This variation in flow angle not only has a dramatic effect on the following car as it closes within 20m, but has a different effect every fraction of a second as the car starts to pull out. To understand this requires both a basic and detailed understanding of the front wing loading.

Figure 10 – Wake structure behind the UAK18. Red shows upwash, blue shows downwash
The downforce generated by wing elements depends on the angle of attack – the angle of the air flow relative to the wing. Downforce grows as this angle increases up to the point where the wing stalls. As seen in figure 10, the center of the wing sees less angle due to the wake but the outboard sections see a higher angle – so long as the car remains directly behind. So part of the wing will create less downforce while other parts create more. Unless those parts are set up at a critical angle and the additional downwash off the tires causes them to stall instead. Similarly, the center of the wing may already be partially stalled in normal running (Figure 11) and the reduced flow angle from the upwash of the diffuser may actually improve performance. Each section of the wing may respond differently, creating more or less downforce and influencing the flow over the rest of the car in an unpredictable manner. Trying to account for this during setup with the typical tools available to the teams would be extremely challenging. Managing it correctly with a split-second change in a pitstop almost impossible! And then the car has to move.

Figure 11 – Flow under the wing showing regions of near stall.
All of the above considerations of the effect of flow angle on different parts of the wing, whether it is better or worse than its normal operating point, and the knock-on effects in feeding the floor and directing flow past the wheels need to be re-evaluated as the driver moves sideways. The center section of the wing passes quickly from the diffuser upwash into the downwash of the wheel. One end of the wing starts to move from the downwash into clear air, while the other moves into the central upwash, before going into the downwash of the second wheel but this time with no counter-balancing effect on the rest of the wing. Even in this simplified passing scenario, the variables keep mounting up and trying to predict the effect of setup changes or new designs on the handling for each of these cars really does require the kind of intensive effort and resources being put to the task.
While this study cannot cover every eventuality, it can help avoid some unintended consequences and provide insight to drive future development in the right direction. The next steps involve considering more complex passing scenarios, the effect of cornering and dynamic vehicle behavior, as well as extending the work to short oval and road course configurations. Every new discovery opens up a new world of exploration, with terabytes more data to process. It is a constantly moving target, but IndyCar is getting in position to close the gap.